Transition Network Analysis
A validated framework for temporal modeling from sequence data — with four layers of statistical rigor.
Process mining, Markov models, and network analysis each offer partial views of sequential behavior. Process mining produces transition graphs with no statistical tests on edges. Markov models estimate transition probabilities but lack the network-analytic toolkit to characterize node importance or meso-level structure. Network analysis methods typically assume static, undirected graphs and do not account for the stochastic, directed nature of sequential processes.
Transition Network Analysis (TNA) integrates probabilistic transition modeling with directed weighted network analysis and wraps both in a layered statistical validation framework (Saqr, Lopez-Pernas, & Tikka, 2025). The method operates on sequence data and constructs directed weighted networks where nodes are states and edge weights encode transition frequencies or probabilities. The distinguishing feature is the statistical infrastructure: split-half model reliability, bootstrap validation of individual edges, case-dropping stability of centrality measures, and permutation-based group comparison with effect sizes. A comprehensive tutorial covers the full pipeline.
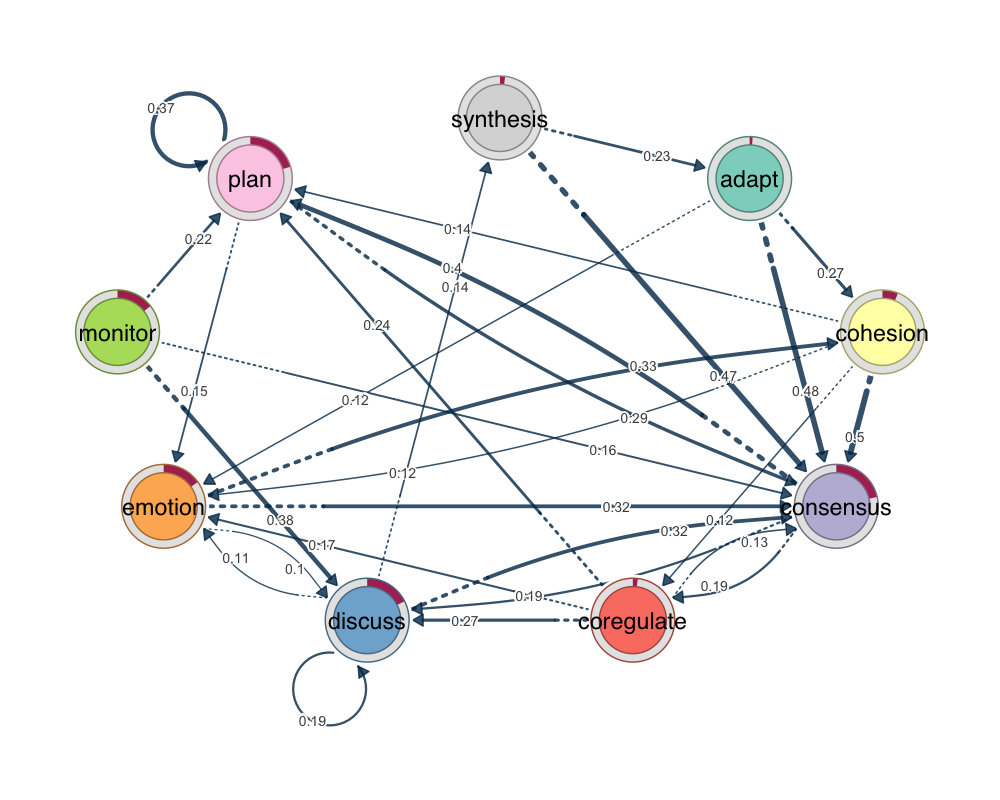
group_regulation dataset, pruned to retain significant transitions. Edge widths and opacity encode transition probabilities.library(tna)
data(group_regulation)
model <- tna(group_regulation)
pruned <- prune(model)
plot(pruned)
Model Types
The same sequence data can be represented as different types of networks. TNA constructs a standard first-order Markov model with row-normalized transition probabilities. FTNA retains raw transition counts without normalization — suited for descriptive analysis when sequence lengths vary (online tutorial). CTNA builds an undirected network from state co-occurrence within sequences. ATNA applies exponential decay based on the gap between states, with forward, backward, and bidirectional variants (vignette). WTNA adjusts for sequence length by inversely weighting transitions. Each model encodes different assumptions. The choice is substantive, not computational.
Four Layers of Validation
The methodological core of TNA is validation at four levels — model, edges, nodes, and networks — described in the TNA primer and formalized in the R package paper.
Model reliability comes first. The reliability() function performs split-half validation: the sequence data is randomly divided into two halves, a TNA model is estimated from each, and the two networks are compared over many iterations (default 1,000). Four metrics quantify agreement: Pearson correlation between edge weights, mean and median absolute difference, and Bray-Curtis dissimilarity. On the group_regulation dataset, split-half Pearson correlations average 0.993 — the model structure is highly reproducible. If reliability is low, no downstream analysis can rescue the findings.
Edge validation uses bootstrap pruning or disparity filtering. Bootstrap pruning resamples sequences with replacement, estimates a model from each sample, and retains edges that appear consistently — yielding a p-value and confidence interval per edge. The disparity filter retains edges whose weights are significant relative to a null model of uniform distribution.
Node validation addresses centrality stability. TNA computes nine centrality measures: InStrength, OutStrength, Closeness (In/Out/combined), Betweenness, random-walk Betweenness, Diffusion, and Clustering coefficient. Case-dropping stability analysis removes increasing proportions of sequences and tracks correlation with original centralities. If correlations hold above 0.7 when half the data is removed, the estimates are reliable.
Network validation uses permutation testing for group comparison. Sequences from both groups are pooled, group labels shuffled, and a test statistic computed for each permutation to obtain a p-value and effect size at the edge or network level. The group analysis tutorial and comparison guide demonstrate this with worked examples.
The four layers form a chain where each guards against a different source of error. Every claim — this transition is significant, this state is central, these groups differ — has been tested against a null hypothesis. The analysis is replicable because validation is built into the method, not left to the analyst’s judgment.
Structure and Metrics
Community detection partitions the network into subsets of states with denser internal connections (vignette). Clique detection identifies maximally connected subgraphs. Sequence-level clustering groups individuals by edit distance, Hamming distance, or longest common subsequence into behaviorally distinct subgroups (clustering tutorial; book chapter). Network-level metrics — density, reciprocity, mean distance, centralization, degree distribution — provide a quantitative fingerprint for comparison across conditions or time periods.
Software Ecosystem
tna for R
The reference implementation on CRAN. Full pipeline: five model types, nine centrality measures, three pruning methods, community detection, clustering, permutation testing, stability analysis, and plotting. Documentation · GitHub
tnapy for Python
Model building, centralities, validation, and visualization for the Python stack. Tutorial
jTNA for Jamovi
Point-and-click TNA through Jamovi's graphical interface. Bootstrap, centralities, community detection — no code required.
TNA Shiny App
Browser-based, zero-install. Upload data, build models, run bootstrap pruning, export results.
Resources
Tutorials
- Comprehensive TNA Tutorial
- Data Preparation Guide
- Clustering Tutorial
- Group Analysis Tutorial
- Model Comparison Guide
- Python Tutorial
Package Vignettes
- Getting Started
- Complete Tutorial
- Data Preparation
- Frequency TNA (FTNA)
- Attention TNA (ATNA)
- Communities and Cliques
- Grouped Sequences
Book Chapters (Springer, 2025)
Publications
- Saqr, M., Lopez-Pernas, S., Tikka, S., et al. (2025). Transition Network Analysis. LAK '25. DOI · arXiv
- Tikka, S., Lopez-Pernas, S., & Saqr, M. (2025). tna: An R Package for TNA. Applied Psychological Measurement. DOI
- Lopez-Pernas, S., et al. (2025). IEEE Transactions on Learning Technologies. DOI
- Törmänen, T., et al. (2025). Learning and Instruction. DOI