Methodological Innovation Software
Scientific software for transition network analysis, complex dynamic systems, and network visualization.
These are scientific software tools for methodological innovation in learning analytics and complex systems research. I had the leading development role or co-developed them with colleagues. They span R packages on CRAN, Python libraries, JavaScript modules, and interactive web applications.
Transition Network Analysis & Complex Dynamic Systems
tna — Transition Network Analysis for R
A rigorous framework for analyzing the dynamics of behavioral processes in learning and beyond. TNA offers a vast array of tools — from building and visualizing transition networks to computing nine centrality measures, detecting communities and cliques, discovering sequential patterns, and clustering learners by their process signatures. What sets it apart is its emphasis on statistical rigor at every level: bootstrapped significance testing verifies which edges and centralities are reliable, permutation tests assess whether group differences are genuine, and model comparison functions quantify structural similarity across conditions, time points, or populations. Published on CRAN and used across dozens of studies in learning analytics and education research.
tnapy — Transition Network Analysis for Python
A full Python port of the TNA framework with exact numerical equivalence to the R package. Supports eight model types (relative, frequency, co-occurrence, reverse, n-gram, gap, window, and attention), nine centrality measures, bootstrap resampling, permutation tests, and over ten visualization functions including network plots, heatmaps, and centrality charts. Designed for researchers who work in the Python data science ecosystem.
tnaj — Transition Network Analysis for JavaScript
A zero-dependency, pure TypeScript implementation of TNA that runs in Node.js, Deno, Bun, and the browser. Ported from the R and Python packages with numerical equivalence validated to machine epsilon (~1e-15). Covers the full API: model building, centrality analysis, pruning, community detection, clique discovery, sequence clustering, group models, and data preparation. Powers the live browser demo.
JTNA — TNA for Jamovi
A comprehensive Jamovi module that brings the full power of transition network analysis to a point-and-click interface — no coding required. Includes three analysis modules: individual TNA with network plots and bootstrap, group TNA with pairwise permutation tests and network difference plots, and cluster TNA that automatically groups sequences and builds separate models per cluster. Supports relative, frequency, co-occurrence, and attention model types, seven community detection algorithms, and centrality stability analysis.
Dynalytics — TNA Shiny Application
A comprehensive Shiny web application for interactive transition network analysis. Offers dedicated modules for individual TNA, group comparison, cluster analysis, co-occurrence networks, one-hot encoding, and social network analysis. Each module provides network visualization, centrality analysis, seven community detection algorithms, clique analysis, bootstrap and permutation testing, pattern discovery, and sequence analysis — all through an accessible browser interface.
codyna — Complex Dynamic Systems in R
An R package for the analysis of complex dynamic systems with a focus on the temporal unfolding of patterns, changes, and state transitions in behavioral data. Supports both time-series and sequence data, providing tools for analyzing and visualizing complexity, identifying patterns, detecting trends and regime shifts, classifying sequence typologies, and computing early warning signals. Published on CRAN.
Visualization
cograph — Complex Network Analysis and Visualization
An R package for producing publication-quality network visualizations with first-class support for TNA models. The main function splot() works directly on tna model objects or raw matrices, offering multiple layout algorithms (oval, circle, Kamada-Kawai, Fruchterman-Reingold), rich node styling with five shape options, configurable edge curvature and arrow sizing, and a clean API that reduces a typical network plot to a single function call.
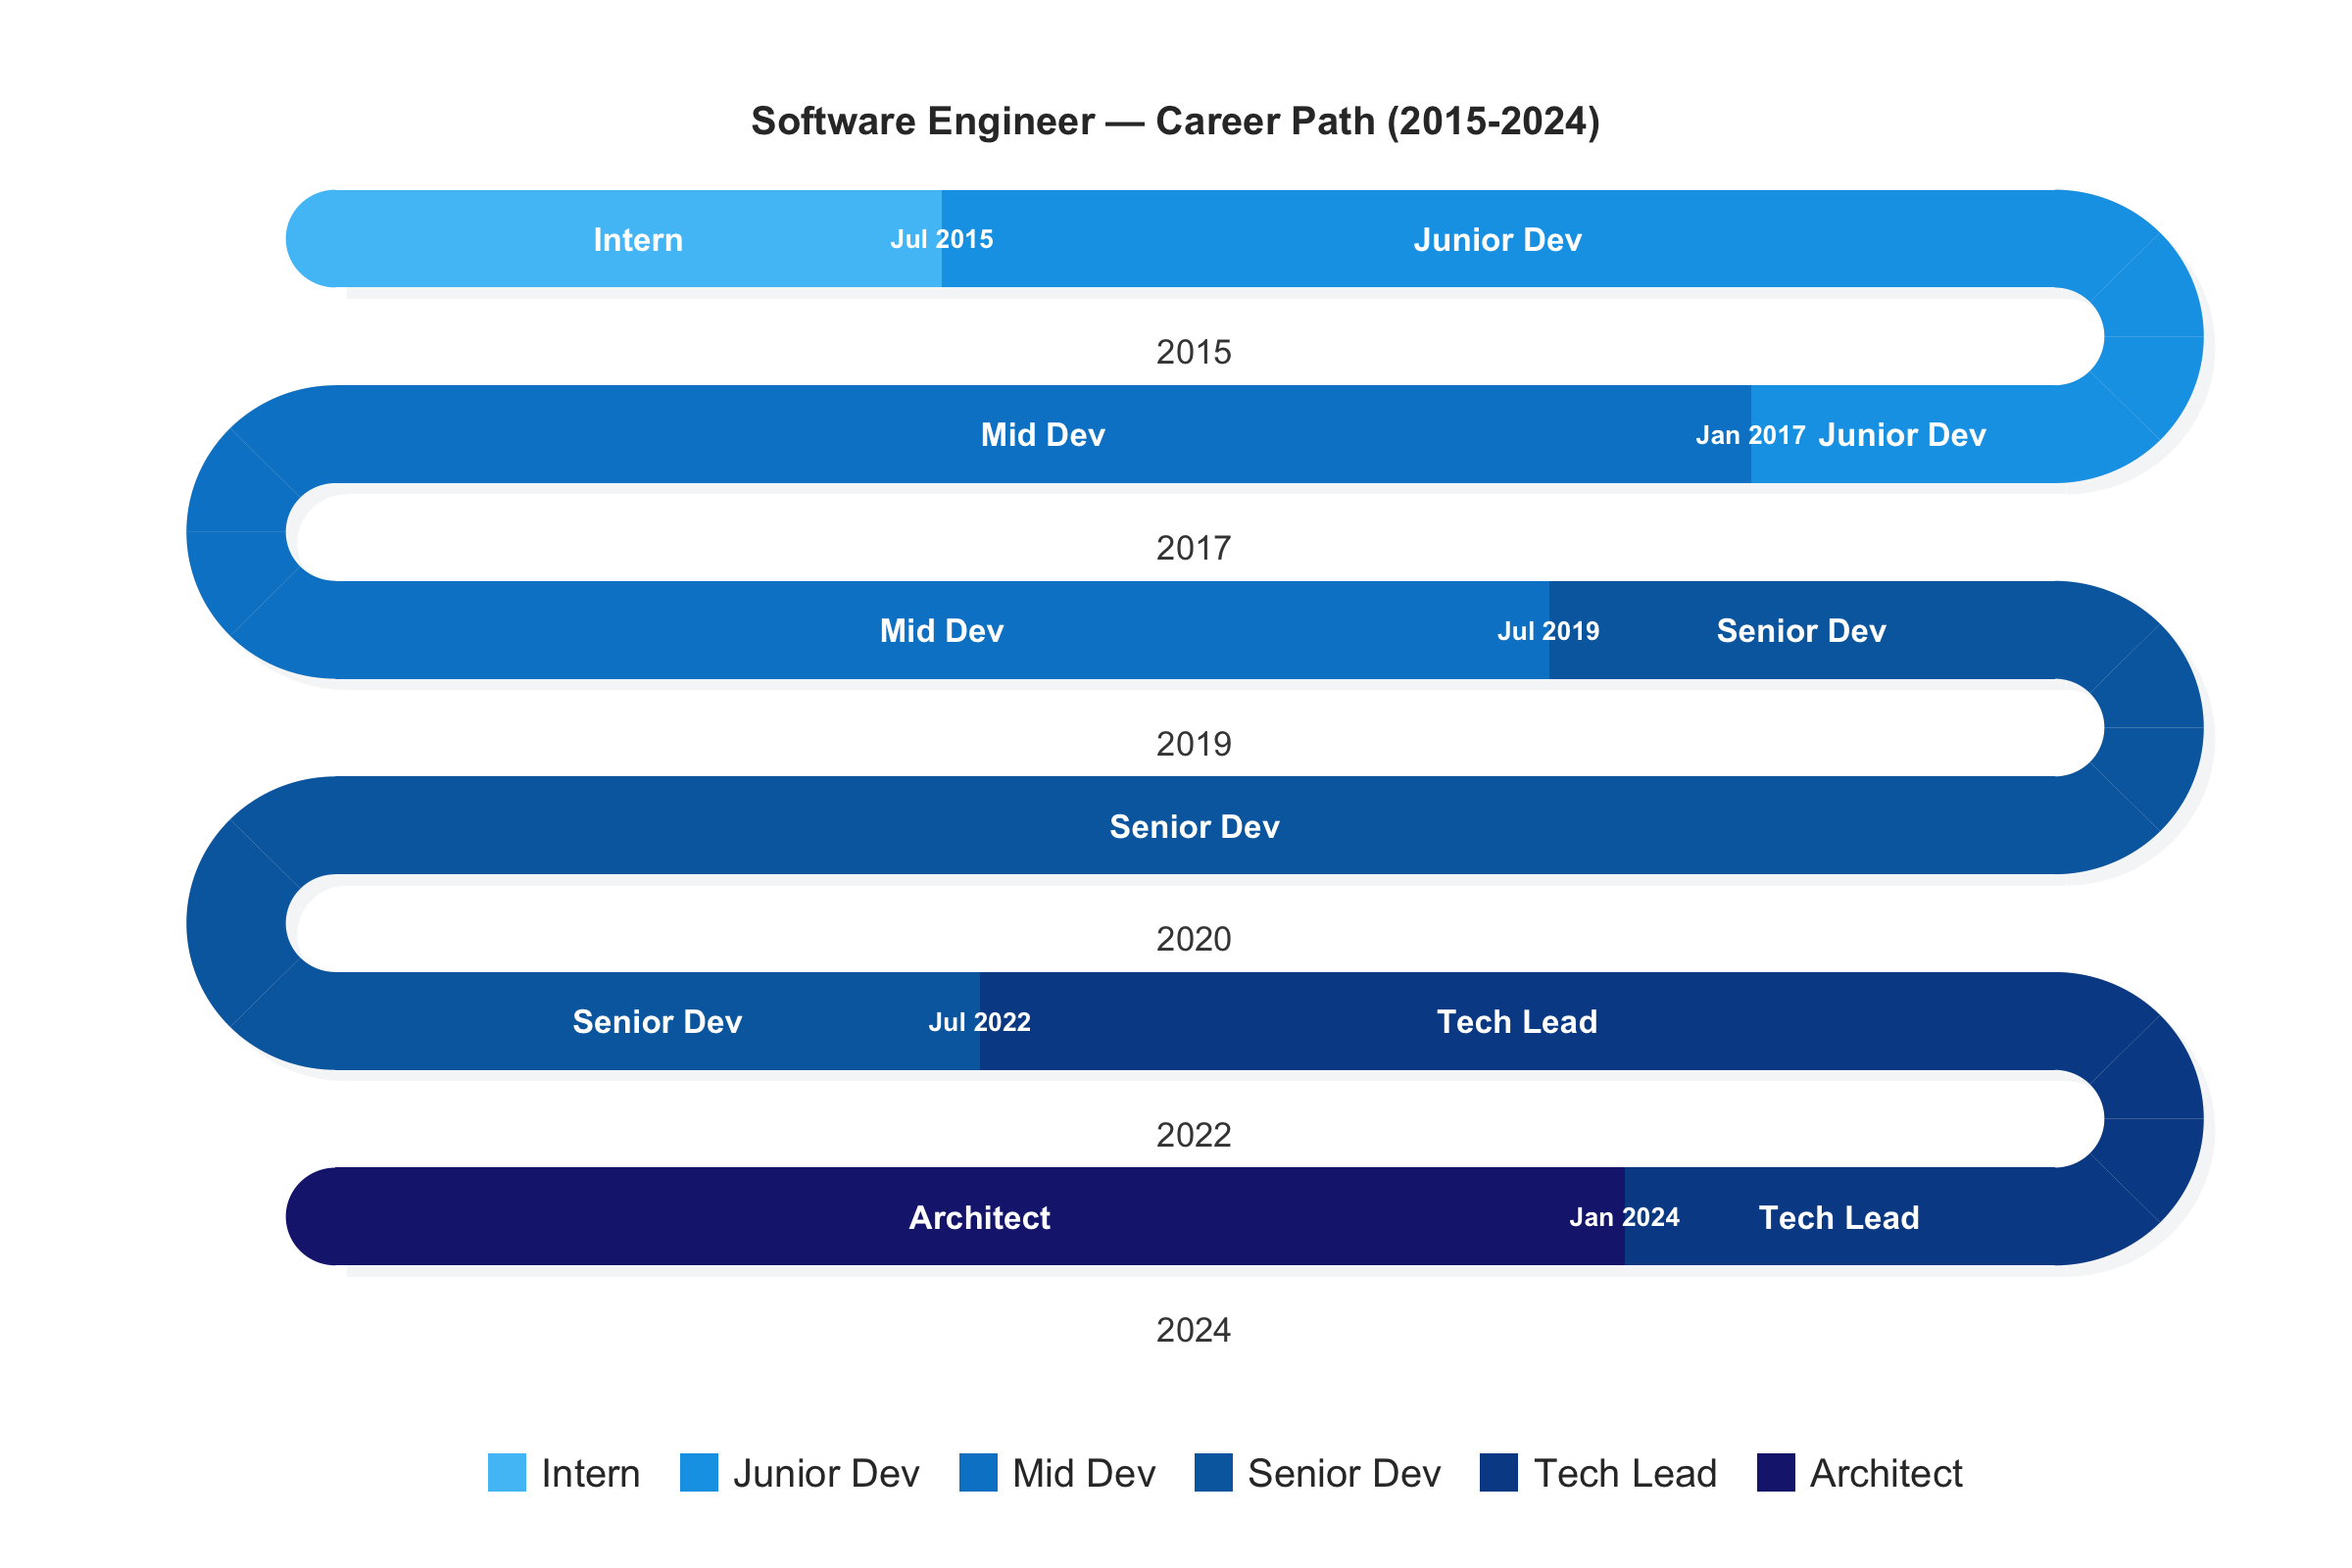
snakeplot — Serpentine Visualizations for Sequential Data
An R package for displaying sequential data — surveys, timelines, activity logs, and state sequences — as compact serpentine layouts using base R graphics with zero dependencies. Long sequences that would stretch beyond screen width are folded into stacked bands connected by U-turn arcs, much like reading lines of text. Eight plotting functions cover categorical sequences, career timelines, survey distributions with inter-item correlations, daily EMA data, activity ribbons, and continuous intensity signals. Ships with 10 color palettes and 3 bundled EMA datasets.