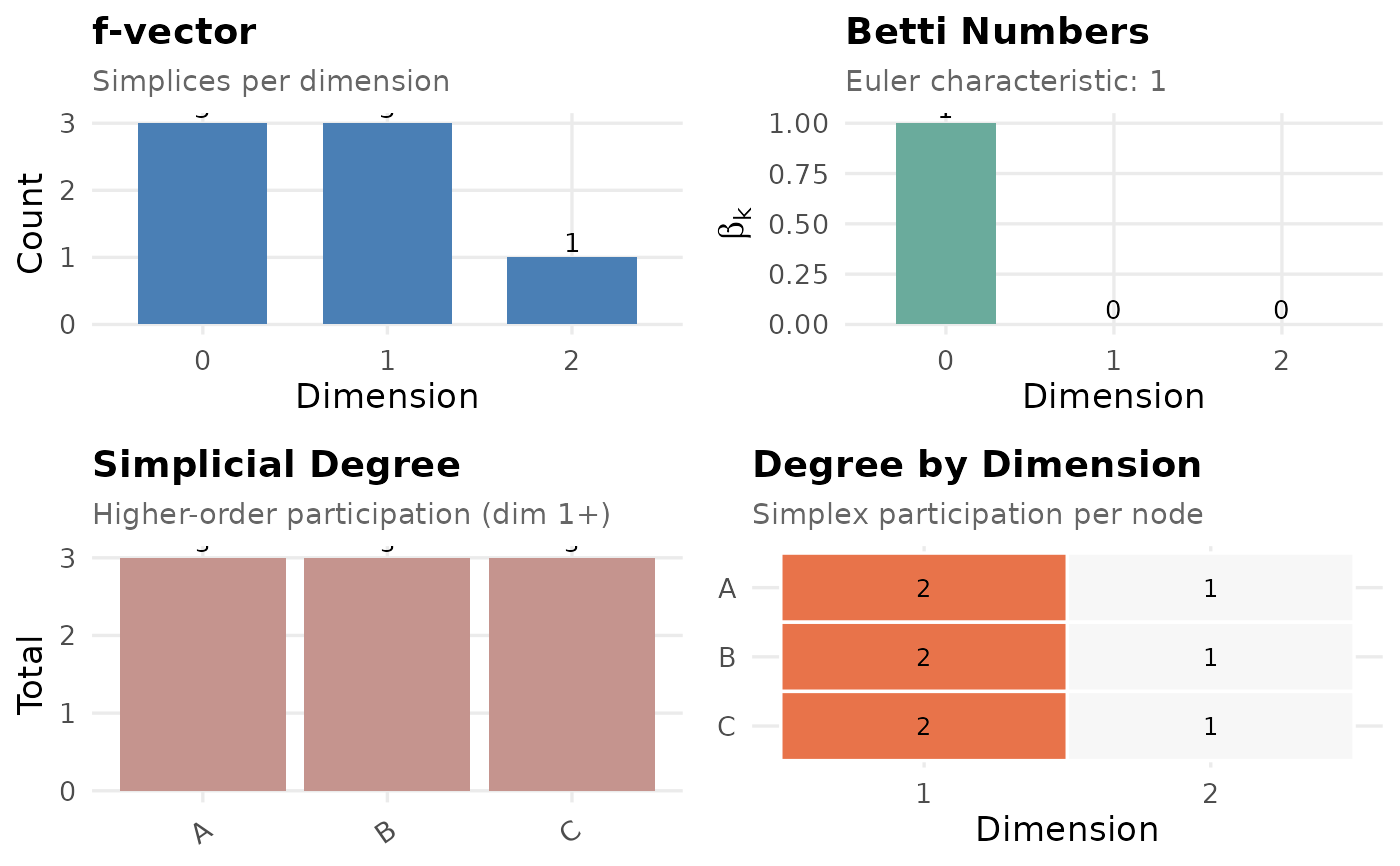
Produces a multi-panel summary: f-vector, simplicial degree ranking, and degree-by-dimension heatmap.
Usage
# S3 method for class 'simplicial_complex'
plot(x, ...)Examples
# \donttest{
seqs <- data.frame(
  V1 = c("A","B","C","A","B"),
  V2 = c("B","C","A","B","C"),
  V3 = c("C","A","B","C","A")
)
net <- build_network(seqs, method = "relative")
sc  <- build_simplicial(net, type = "clique")
plot(sc)

# }
# }