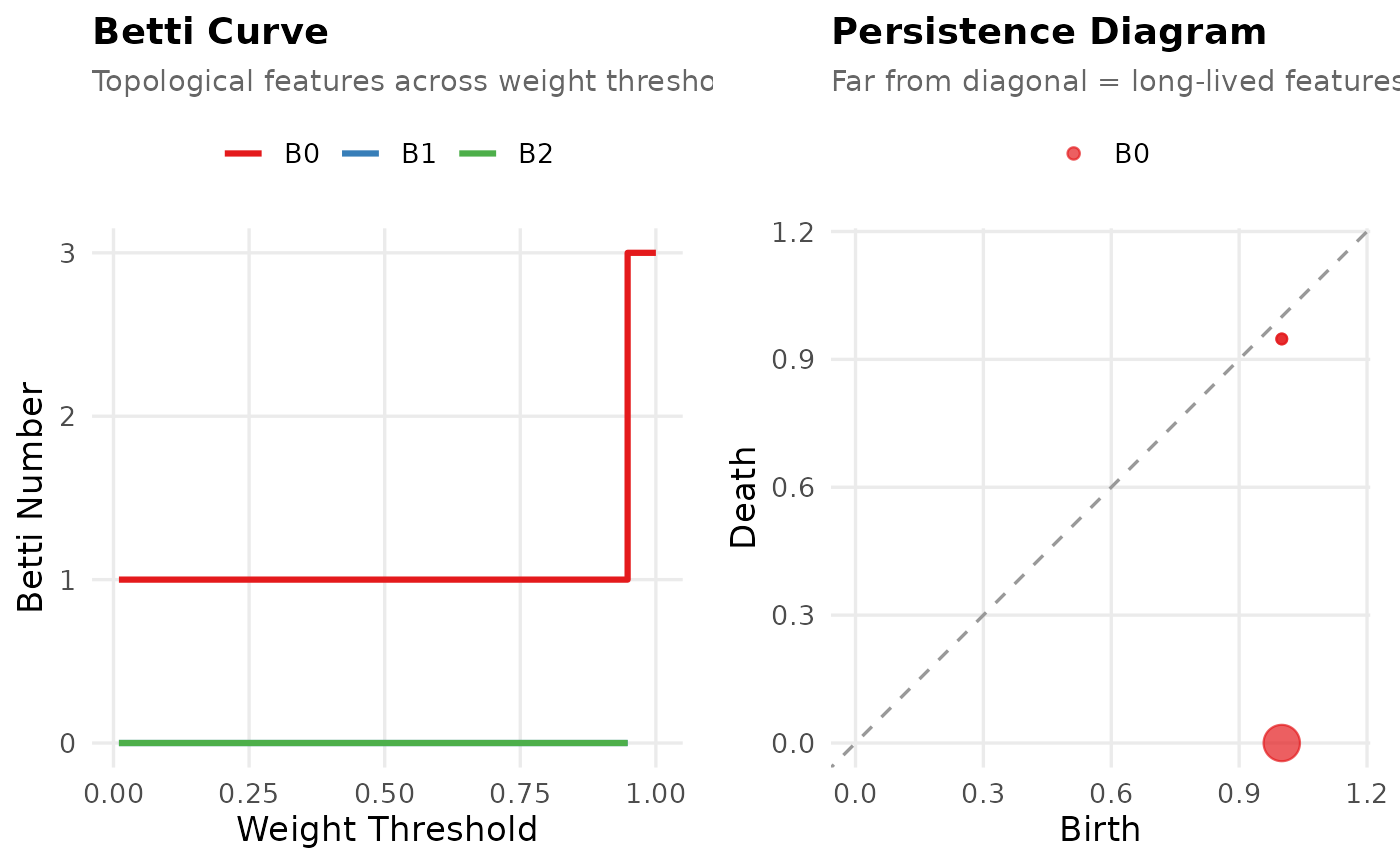
Two panels: Betti curve (threshold vs Betti number) and persistence diagram (birth vs death).
Usage
# S3 method for class 'persistent_homology'
plot(x, ...)Examples
# \donttest{
seqs <- data.frame(
  V1 = c("A","B","C","A","B"),
  V2 = c("B","C","A","B","C"),
  V3 = c("C","A","B","C","A")
)
net <- build_network(seqs, method = "relative")
ph  <- persistent_homology(net)
if (requireNamespace("gridExtra", quietly = TRUE)) plot(ph)

# }
# }