Plot Sequence Clustering Results
Usage
# S3 method for class 'net_clustering'
plot(x, type = c("silhouette", "mds", "heatmap", "predictors"), ...)
Arguments
- x
A net_clustering object.
- type
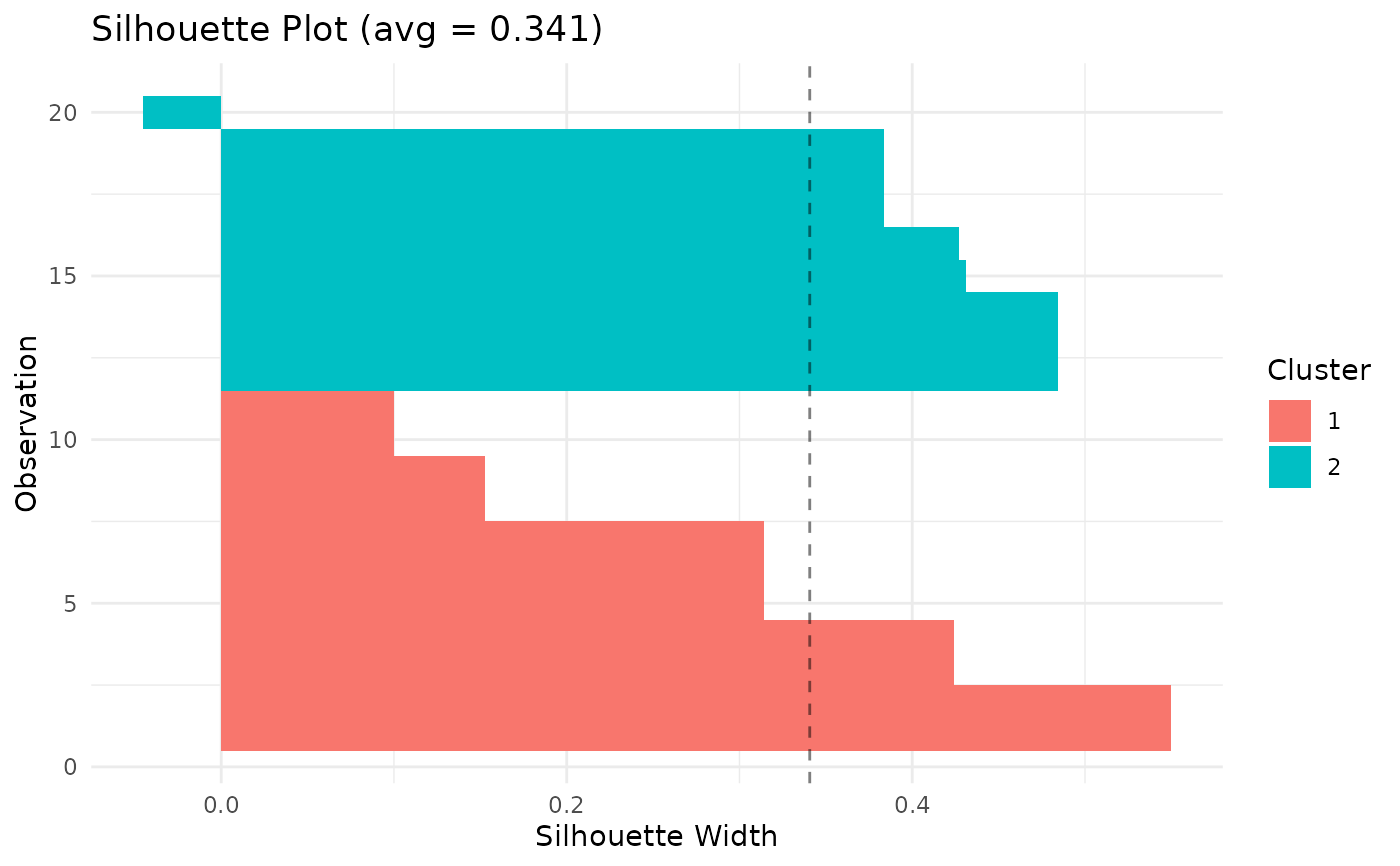
Character. Plot type: "silhouette" (per-observation
silhouette bars), "mds" (2D MDS projection), or
"heatmap" (distance matrix heatmap ordered by cluster).
Default: "silhouette".
- ...
Additional arguments (currently unused).
Value
A ggplot object (invisibly).
Examples
# \donttest{
set.seed(1)
seqs <- data.frame(
  V1 = sample(c("A","B","C"), 20, TRUE),
  V2 = sample(c("A","B","C"), 20, TRUE),
  V3 = sample(c("A","B","C"), 20, TRUE)
)
cl <- cluster_data(seqs, k = 2)
plot(cl, type = "silhouette")

# }
# }