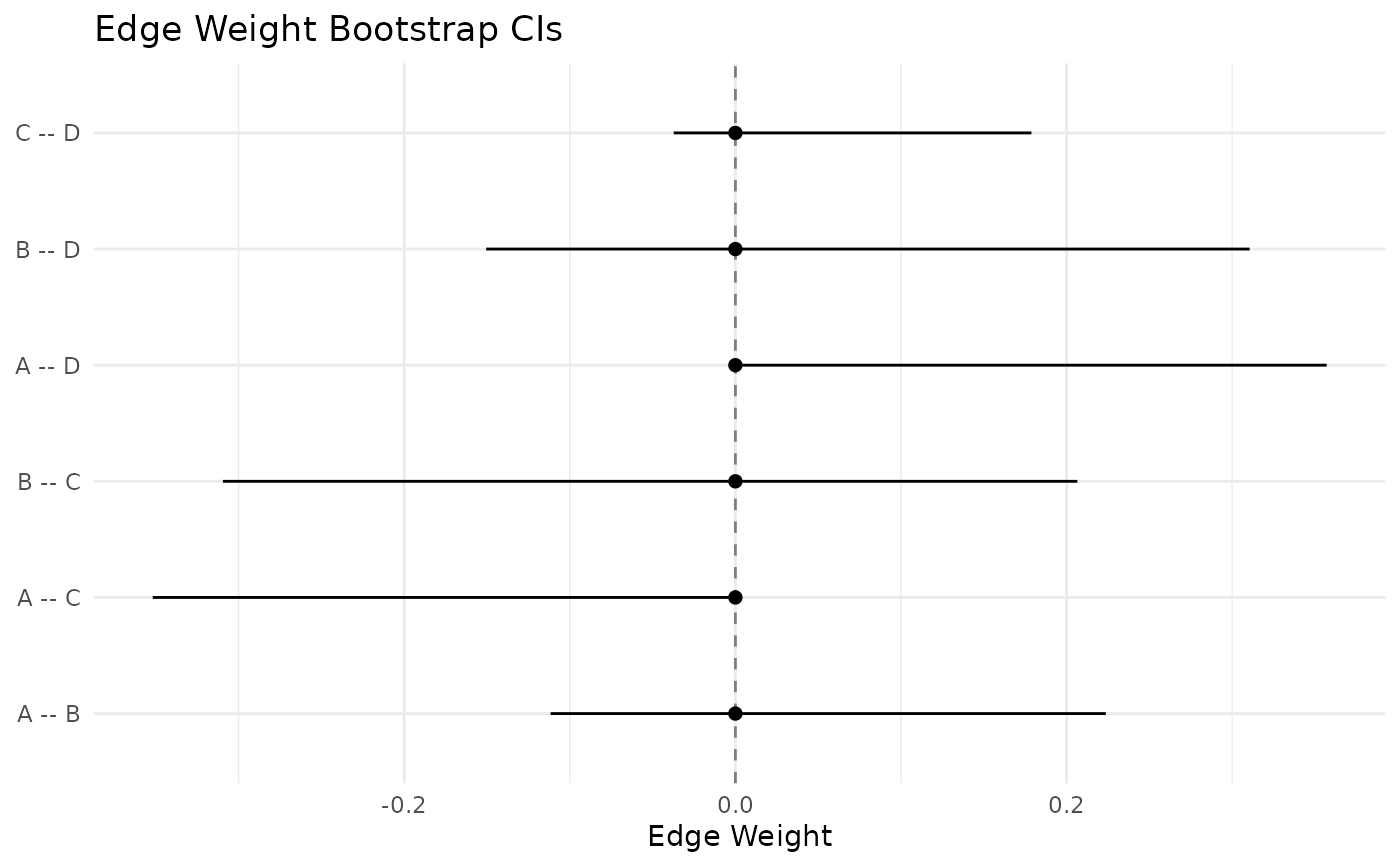
Plots bootstrap results for GLASSO networks.
Usage
# S3 method for class 'boot_glasso'
plot(x, type = "edges", measure = NULL, ...)
Arguments
- x
A
boot_glassoobject.- type
Character. Plot type:
"edges"(default),"stability","edge_diff","centrality_diff", or"inclusion".- measure
Character. Centrality measure for
type = "centrality_diff"(default: first available measure).- ...
Additional arguments passed to plotting functions. For
type = "edge_diff"andtype = "centrality_diff", acceptsorder:"sample"(default, sorted by value) or"id"(alphabetical).
Examples
# \donttest{
set.seed(42)
mat <- matrix(rnorm(60), ncol = 4)
colnames(mat) <- LETTERS[1:4]
boot <- boot_glasso(as.data.frame(mat), iter = 20, cs_iter = 10,
  centrality = "strength", seed = 42)
plot(boot, type = "edges")

# }
# }